Growing up a math nerd in Los Angeles, I was preternaturally drawn to Hollywood metrics. My dad would bring home Variety and The Hollywood Reporter, and I would comb over the latest box office numbers and television ratings.
So it was that I was compelled to read Asymco’s lengthy exegesis on Hollywood box office data over the last 35 years.
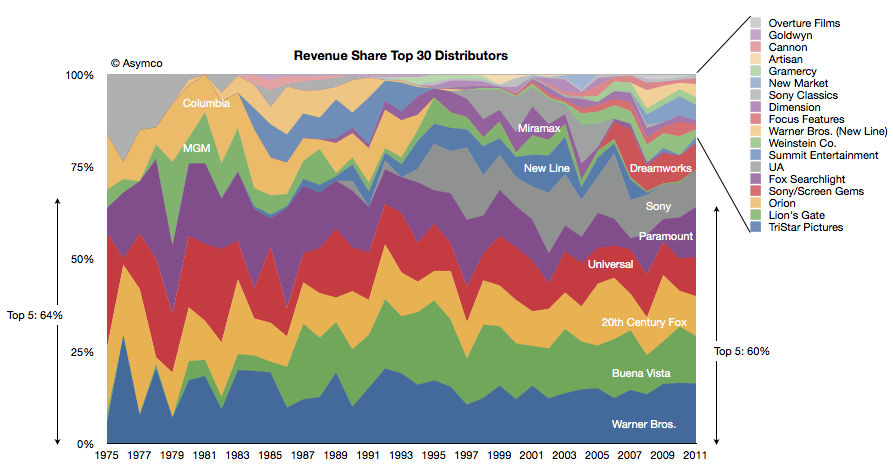
Of all the charts and graphs shown, I found this the most explicative:
 Click for full size.
It shows that the type 5 studios have pretty much remained the same, and that their proportion of overall box office has held steady, too.
I can’t think of a single other industry where this would be true.
It demonstrates just how… hardened the film industry is, and how unreceptive to innovation and new thinking. This graph is a depiction of the industry’s sclerosis. I suspect that this graph is made possible by the overwhelming favoritism our government has shown the film industry (particularly in the extending of copyright), which has created an unfair advantage for incumbents, and made it nearly impossible for upstarts to get a foothold. It’s also why Hollywood throws so much weight behind suffocating legislation such as SOPA and PIPA — if you’re industry has no new ideas, then lobby to protect the old ways for as long as possible.